
design
data visualization and infographics. Data made clearer. More accessible. More interesting. More memorable.
Part of my job as senior research editor for the RAND Corporation was helping authors communicate not only through writing but also through images. I designed and edited hundreds of infographics, data visualizations, and tables to make their methods, findings, analysis, and recommendations clearer and more accessible. In August 2020, I completed a (fantastic) certificate program in infographics and data visualization with the Parsons School of Design at the New School. I’m still a fledgling, but I’ve made a few attempts out of the nest. See them in the samples below. About 20 years ago, I also completed half a certificate in digital design from the Art Institutes of Pittsburgh and Online. I have a smattering of samples from then, too.


my parsons classes
data visualization 101, taught by rye zupancis, fall 2019
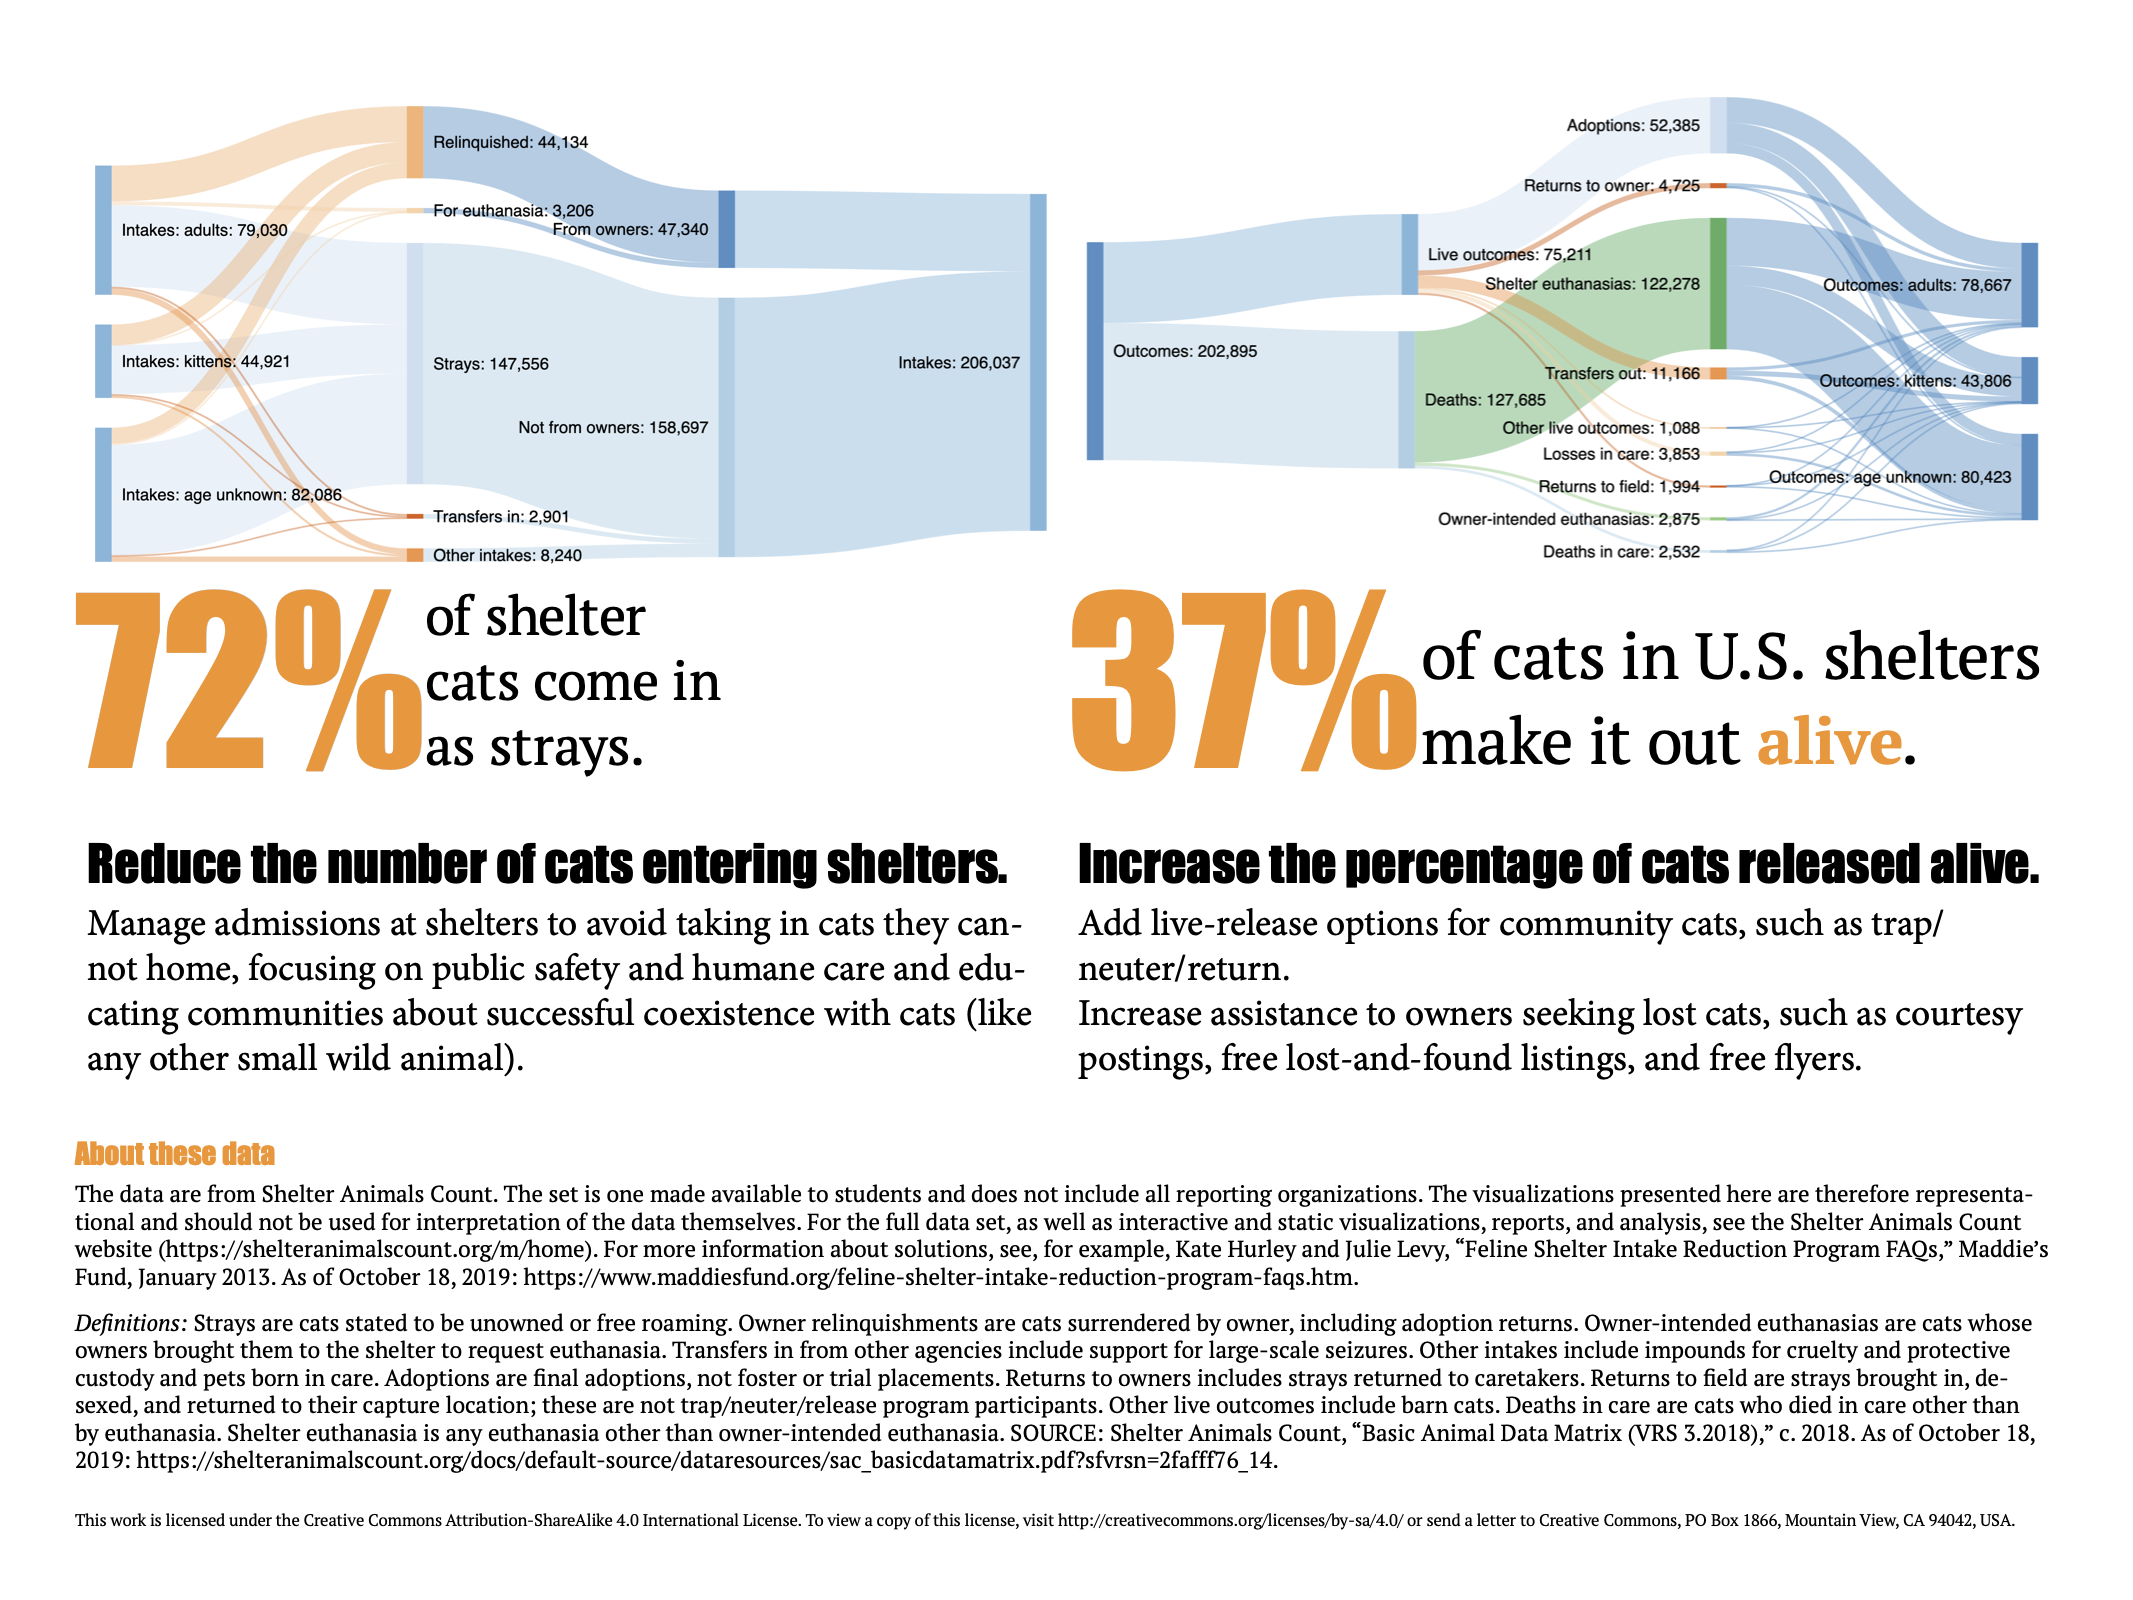
designing information graphics, taught by roger kenny, fall 2019
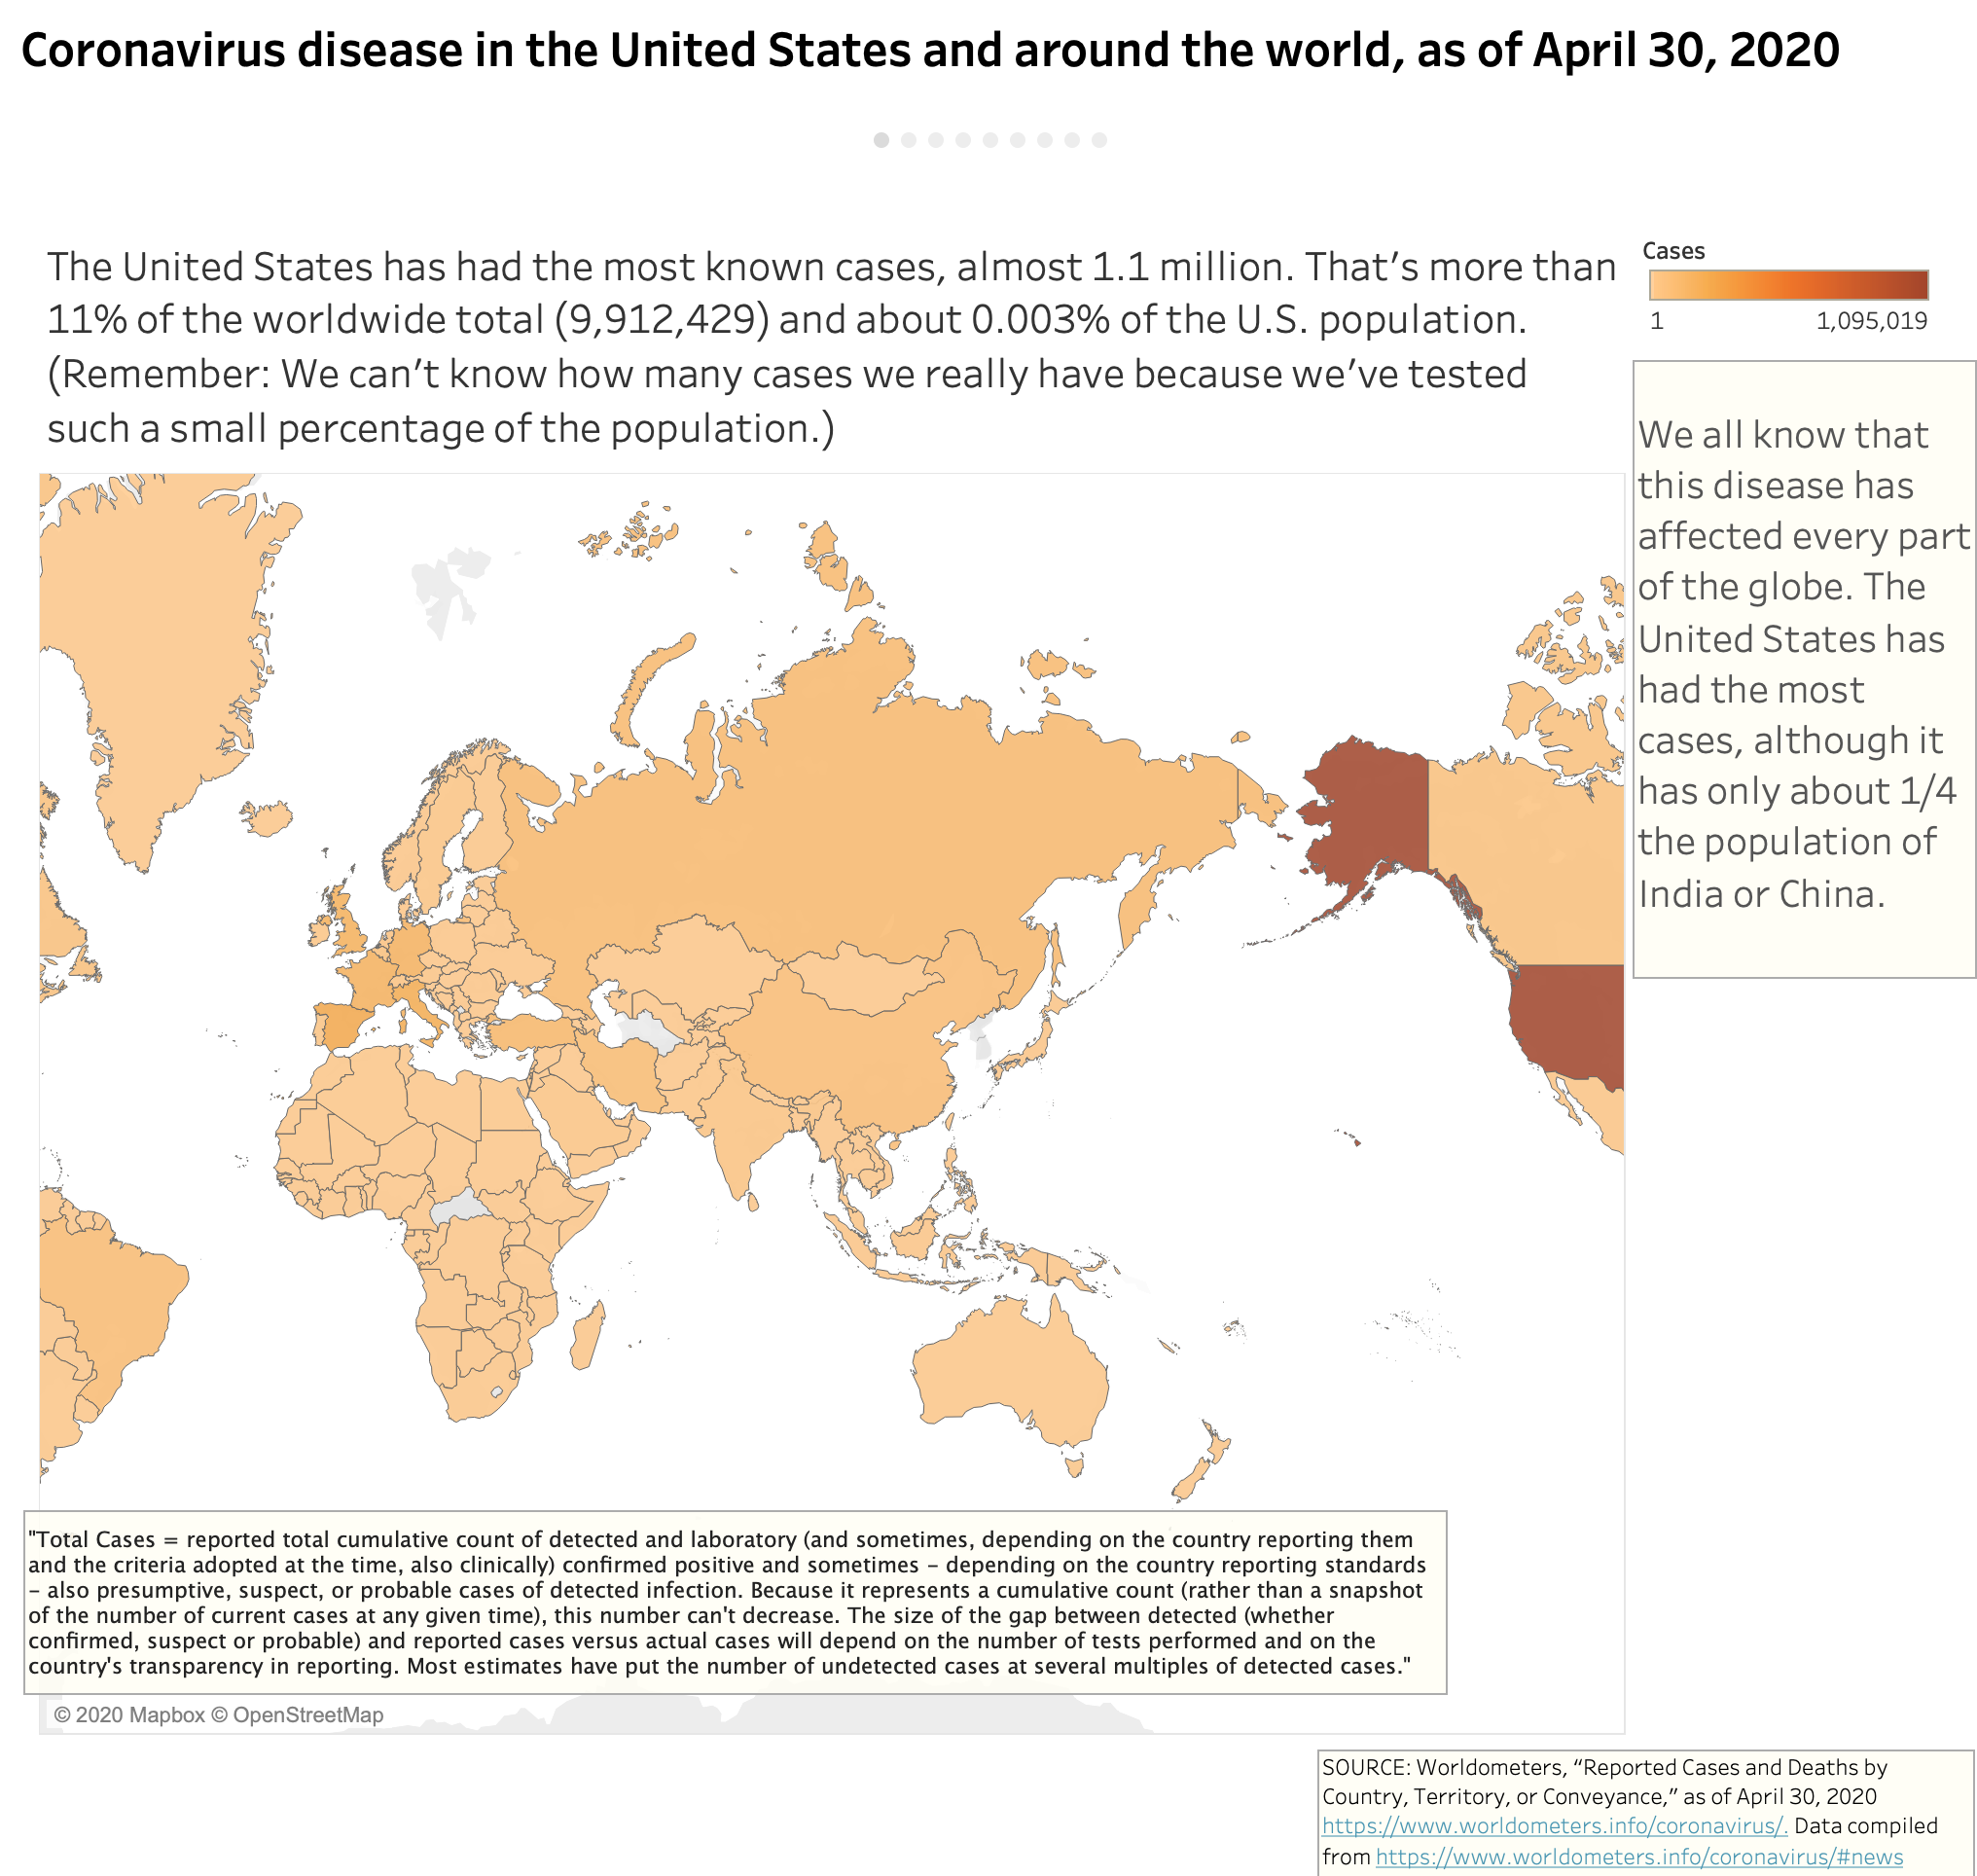
information design for visual storytelling, taught by emily chu, winter 2020
data and analytics for visualization and business analytics, taught by lucianne millan, spring 2020
data visualization portfolio development, taught by larry buchanan, summer 2020